Usability Testing
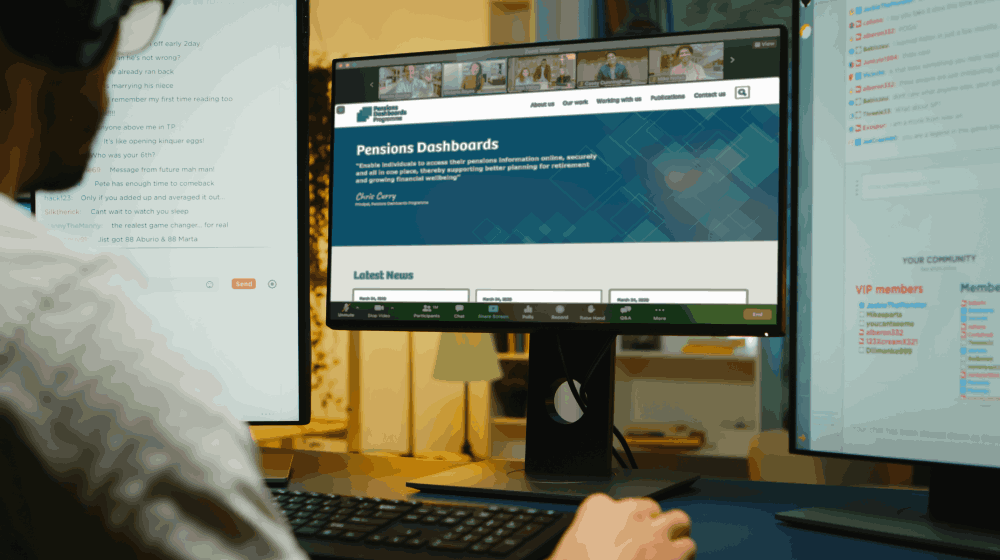
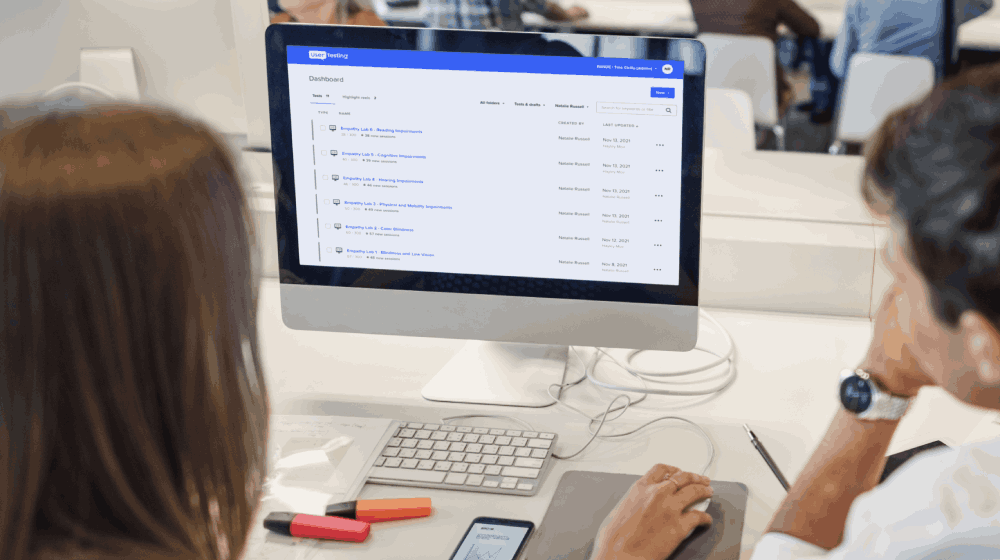
Sessions were conducted to quantitatively measure user interactions with the site and gather data on task completion rates, time on task, and error rates. UserTesting was used for testing user interactions, Google Analytics for tracking user behaviour, and Hotjar to create heat maps.
Process
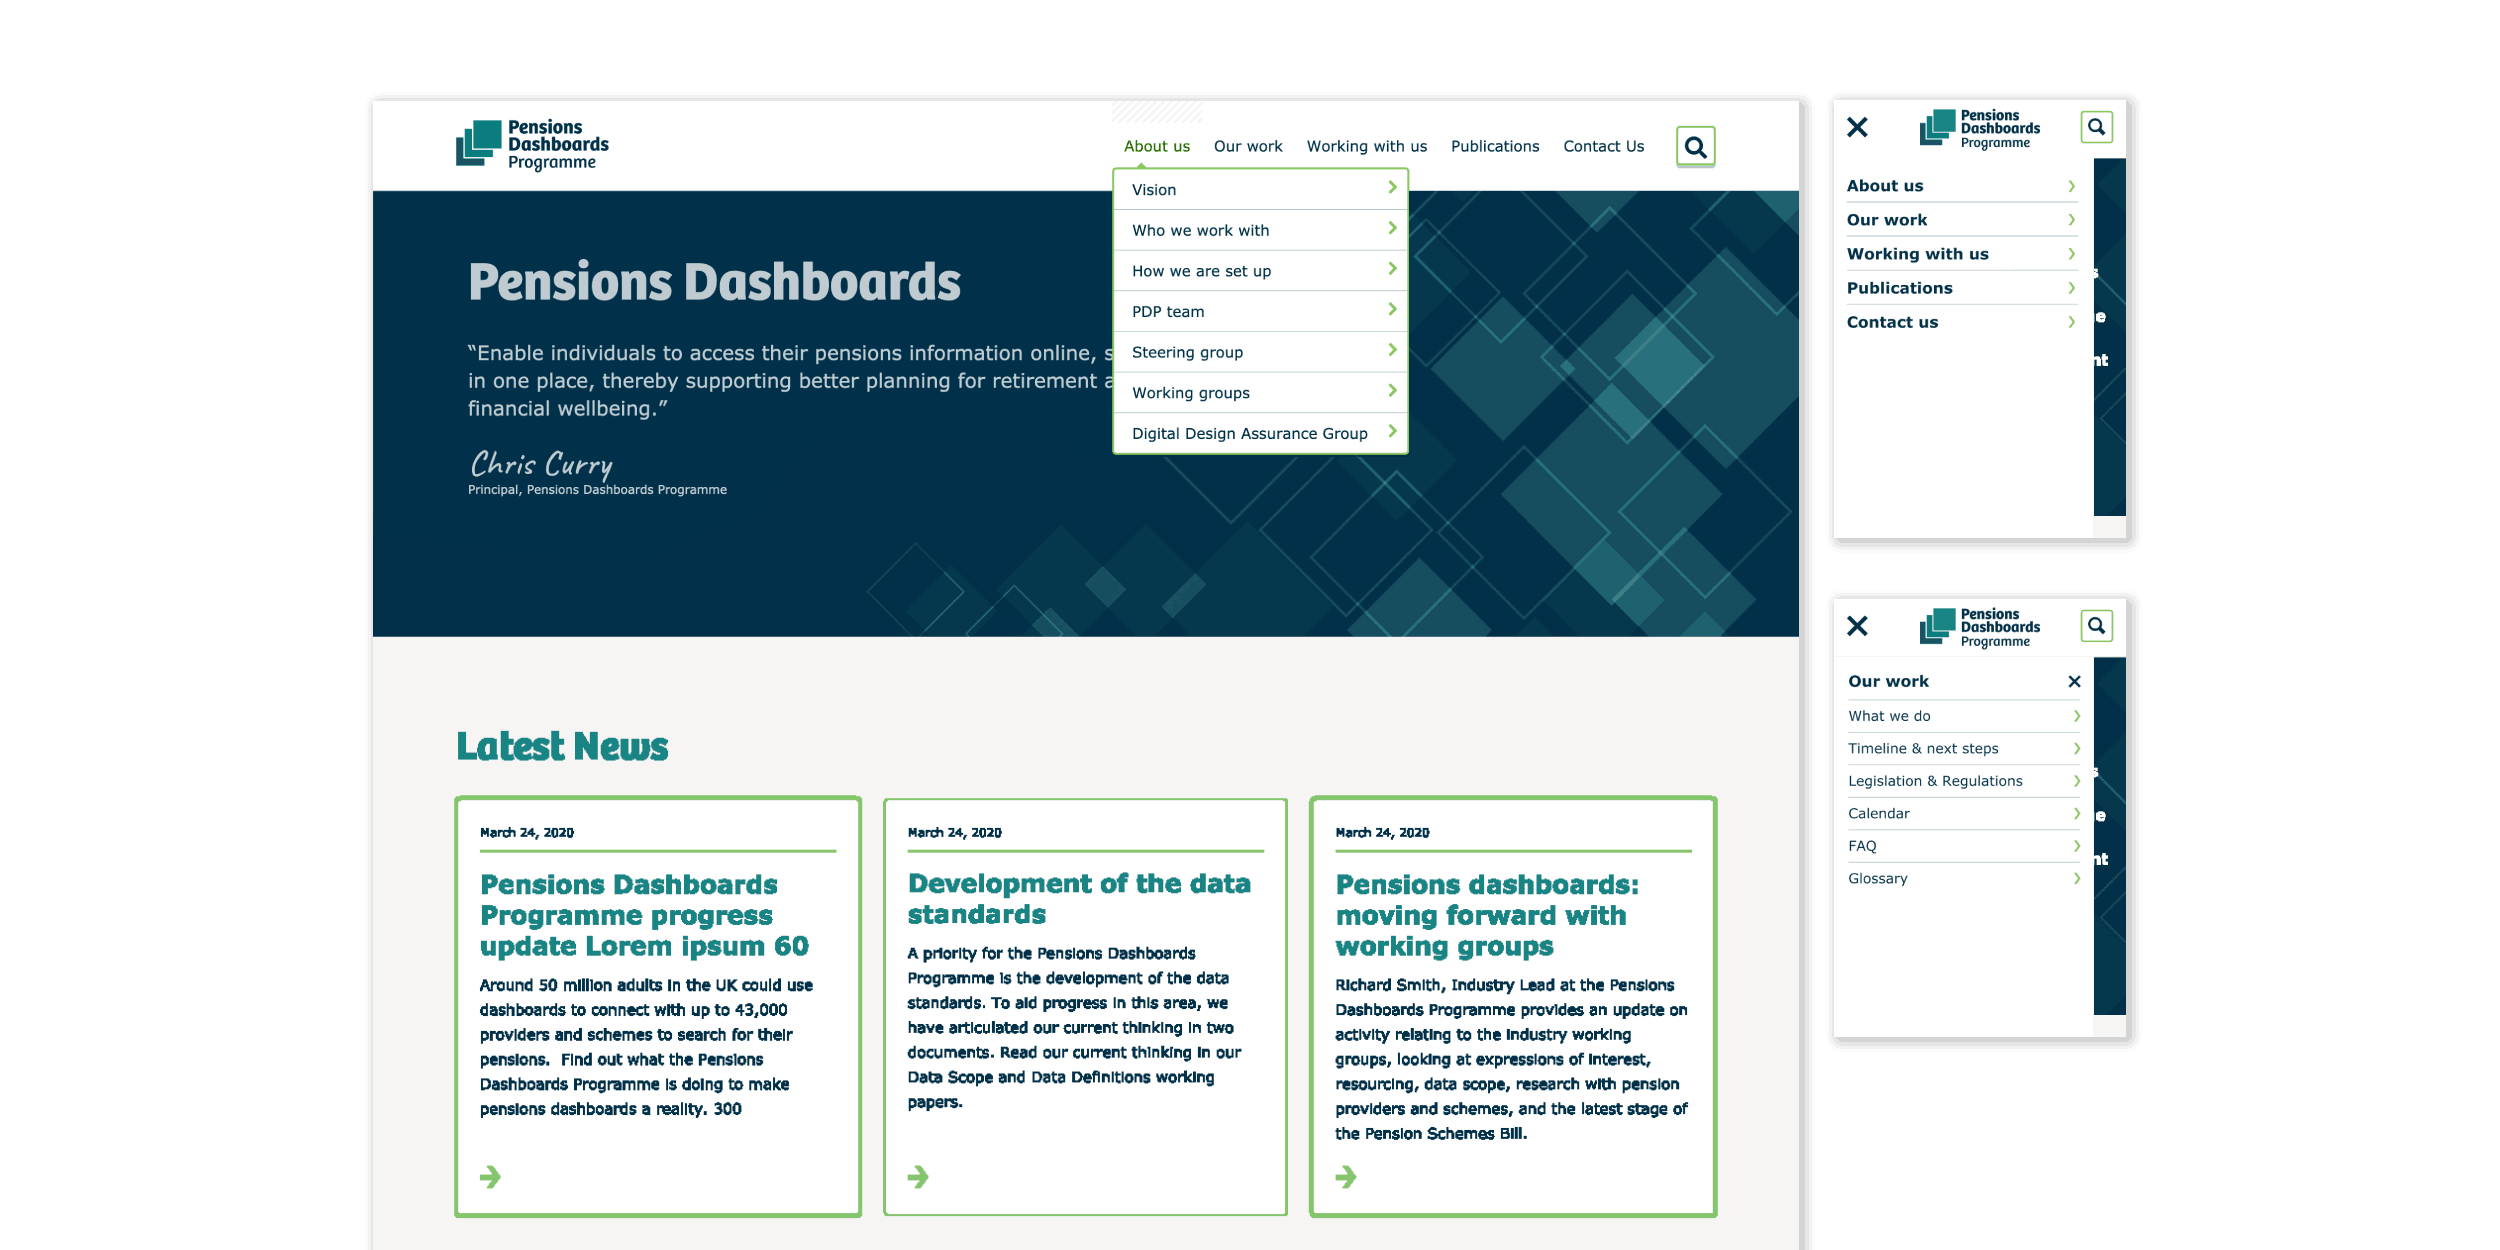
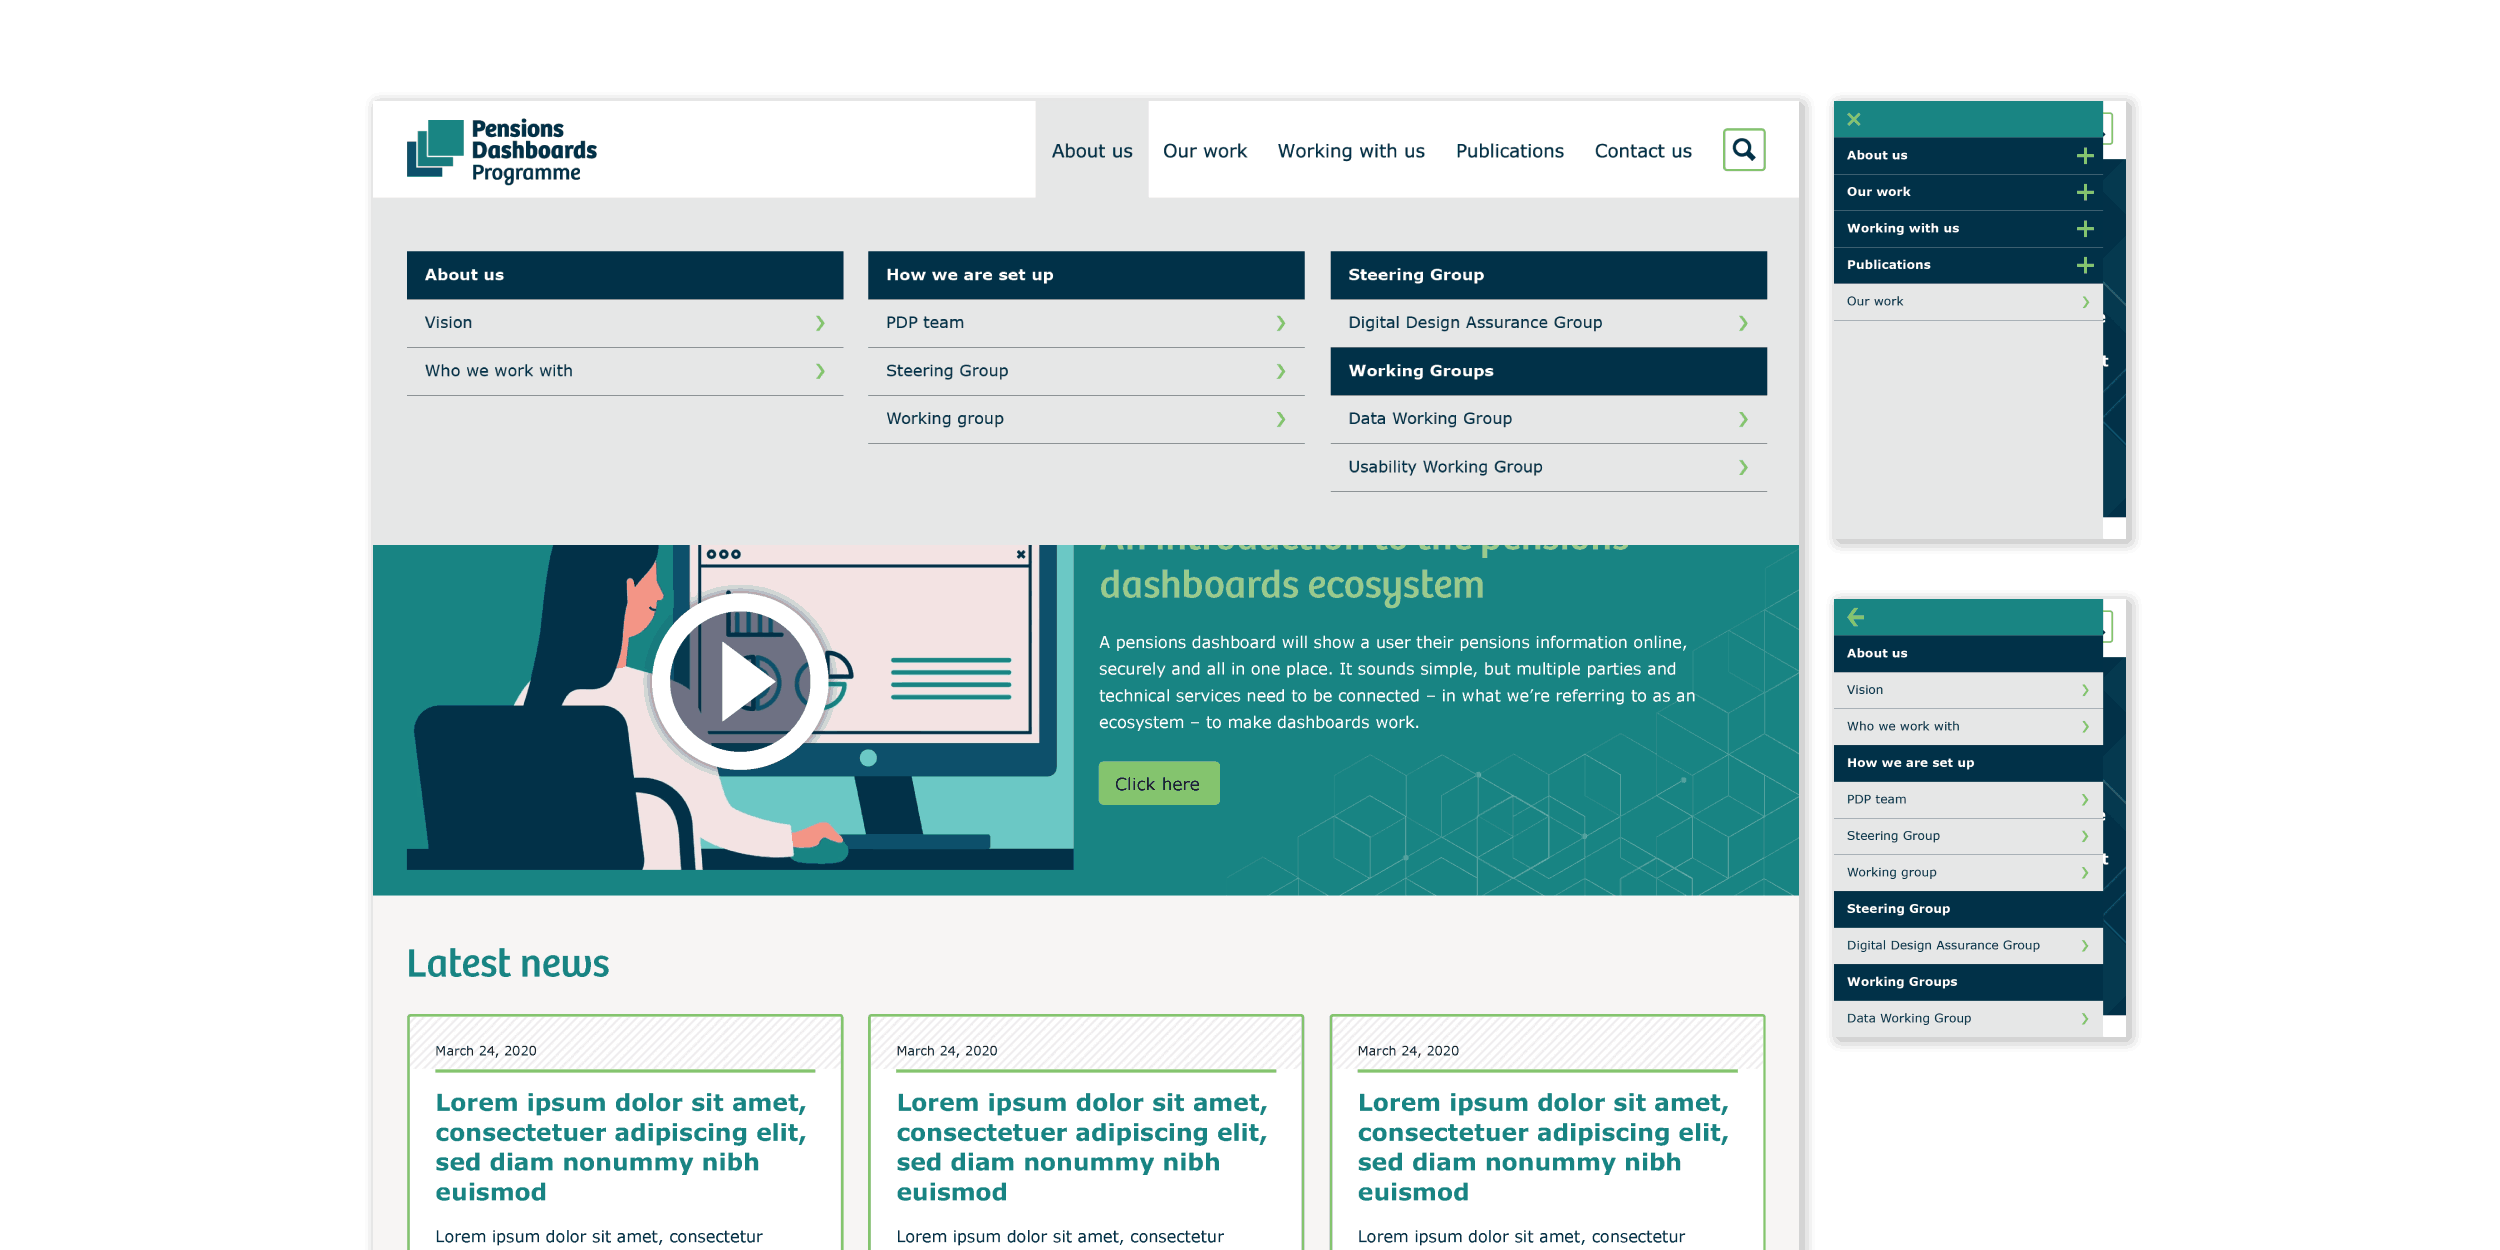
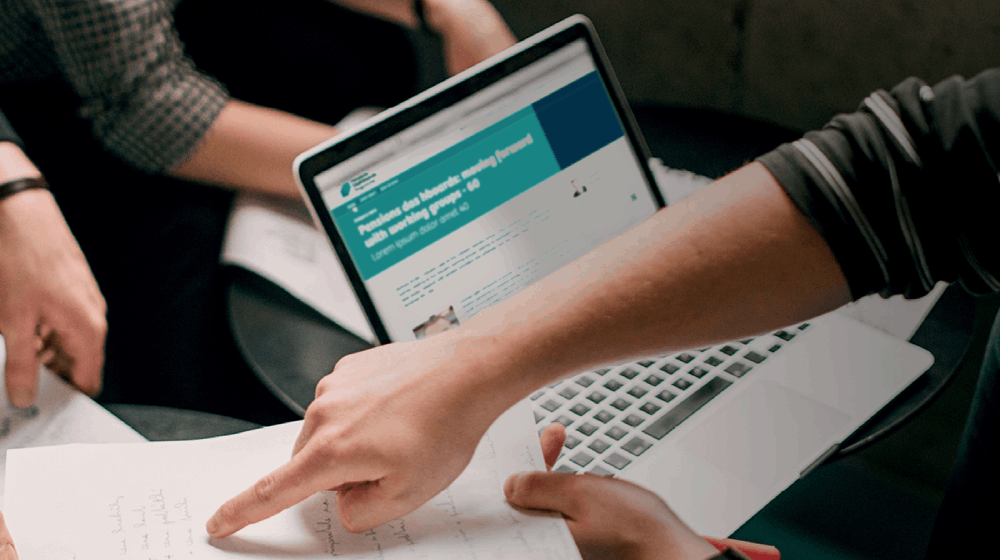
Participants were given tasks to complete, including locating financial tools, accessing explainer videos, finding glossary definitions, and navigating to relevant resources. Interactions were recorded, and metrics such as time to complete tasks, number of clicks, and errors were tracked. Feedback was also provided after each task.
Outcomes
Significant bottlenecks and inefficiencies in the user journey were uncovered. Participants struggled with tasks such as locating financial planning tools and explainer videos, often taking longer than expected. These issues highlighted the need for simpler navigation and clearer paths to key content.


 An audit was conducted to evaluate the website’s performance in key areas of SEO and web design, providing actionable suggestions for improvements.
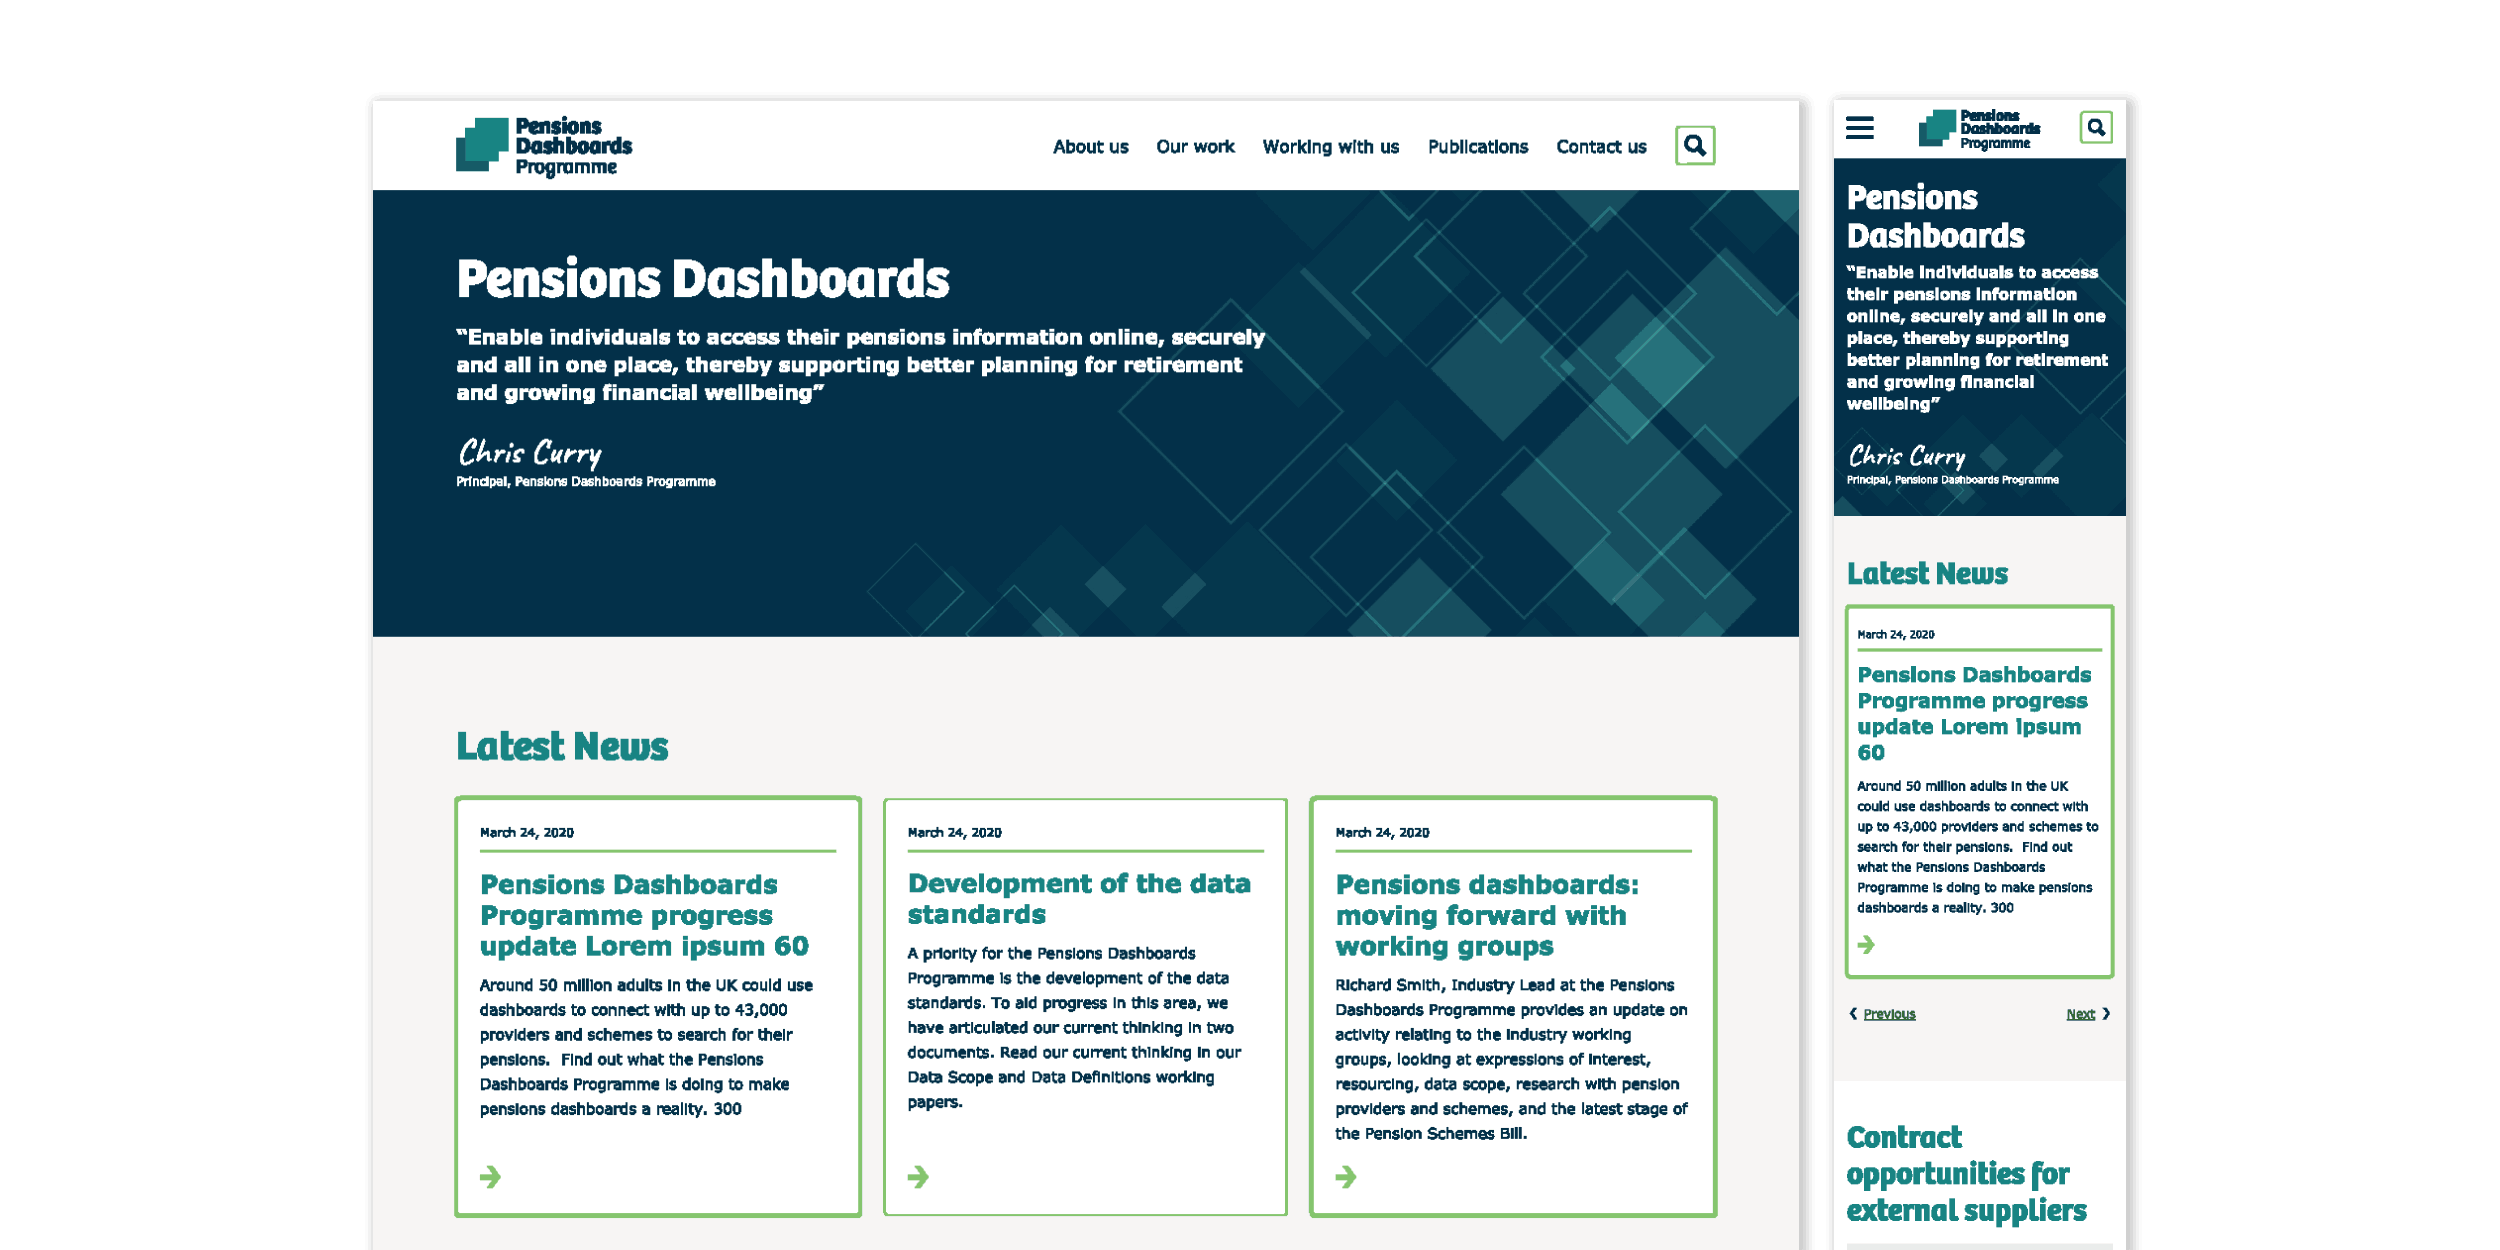
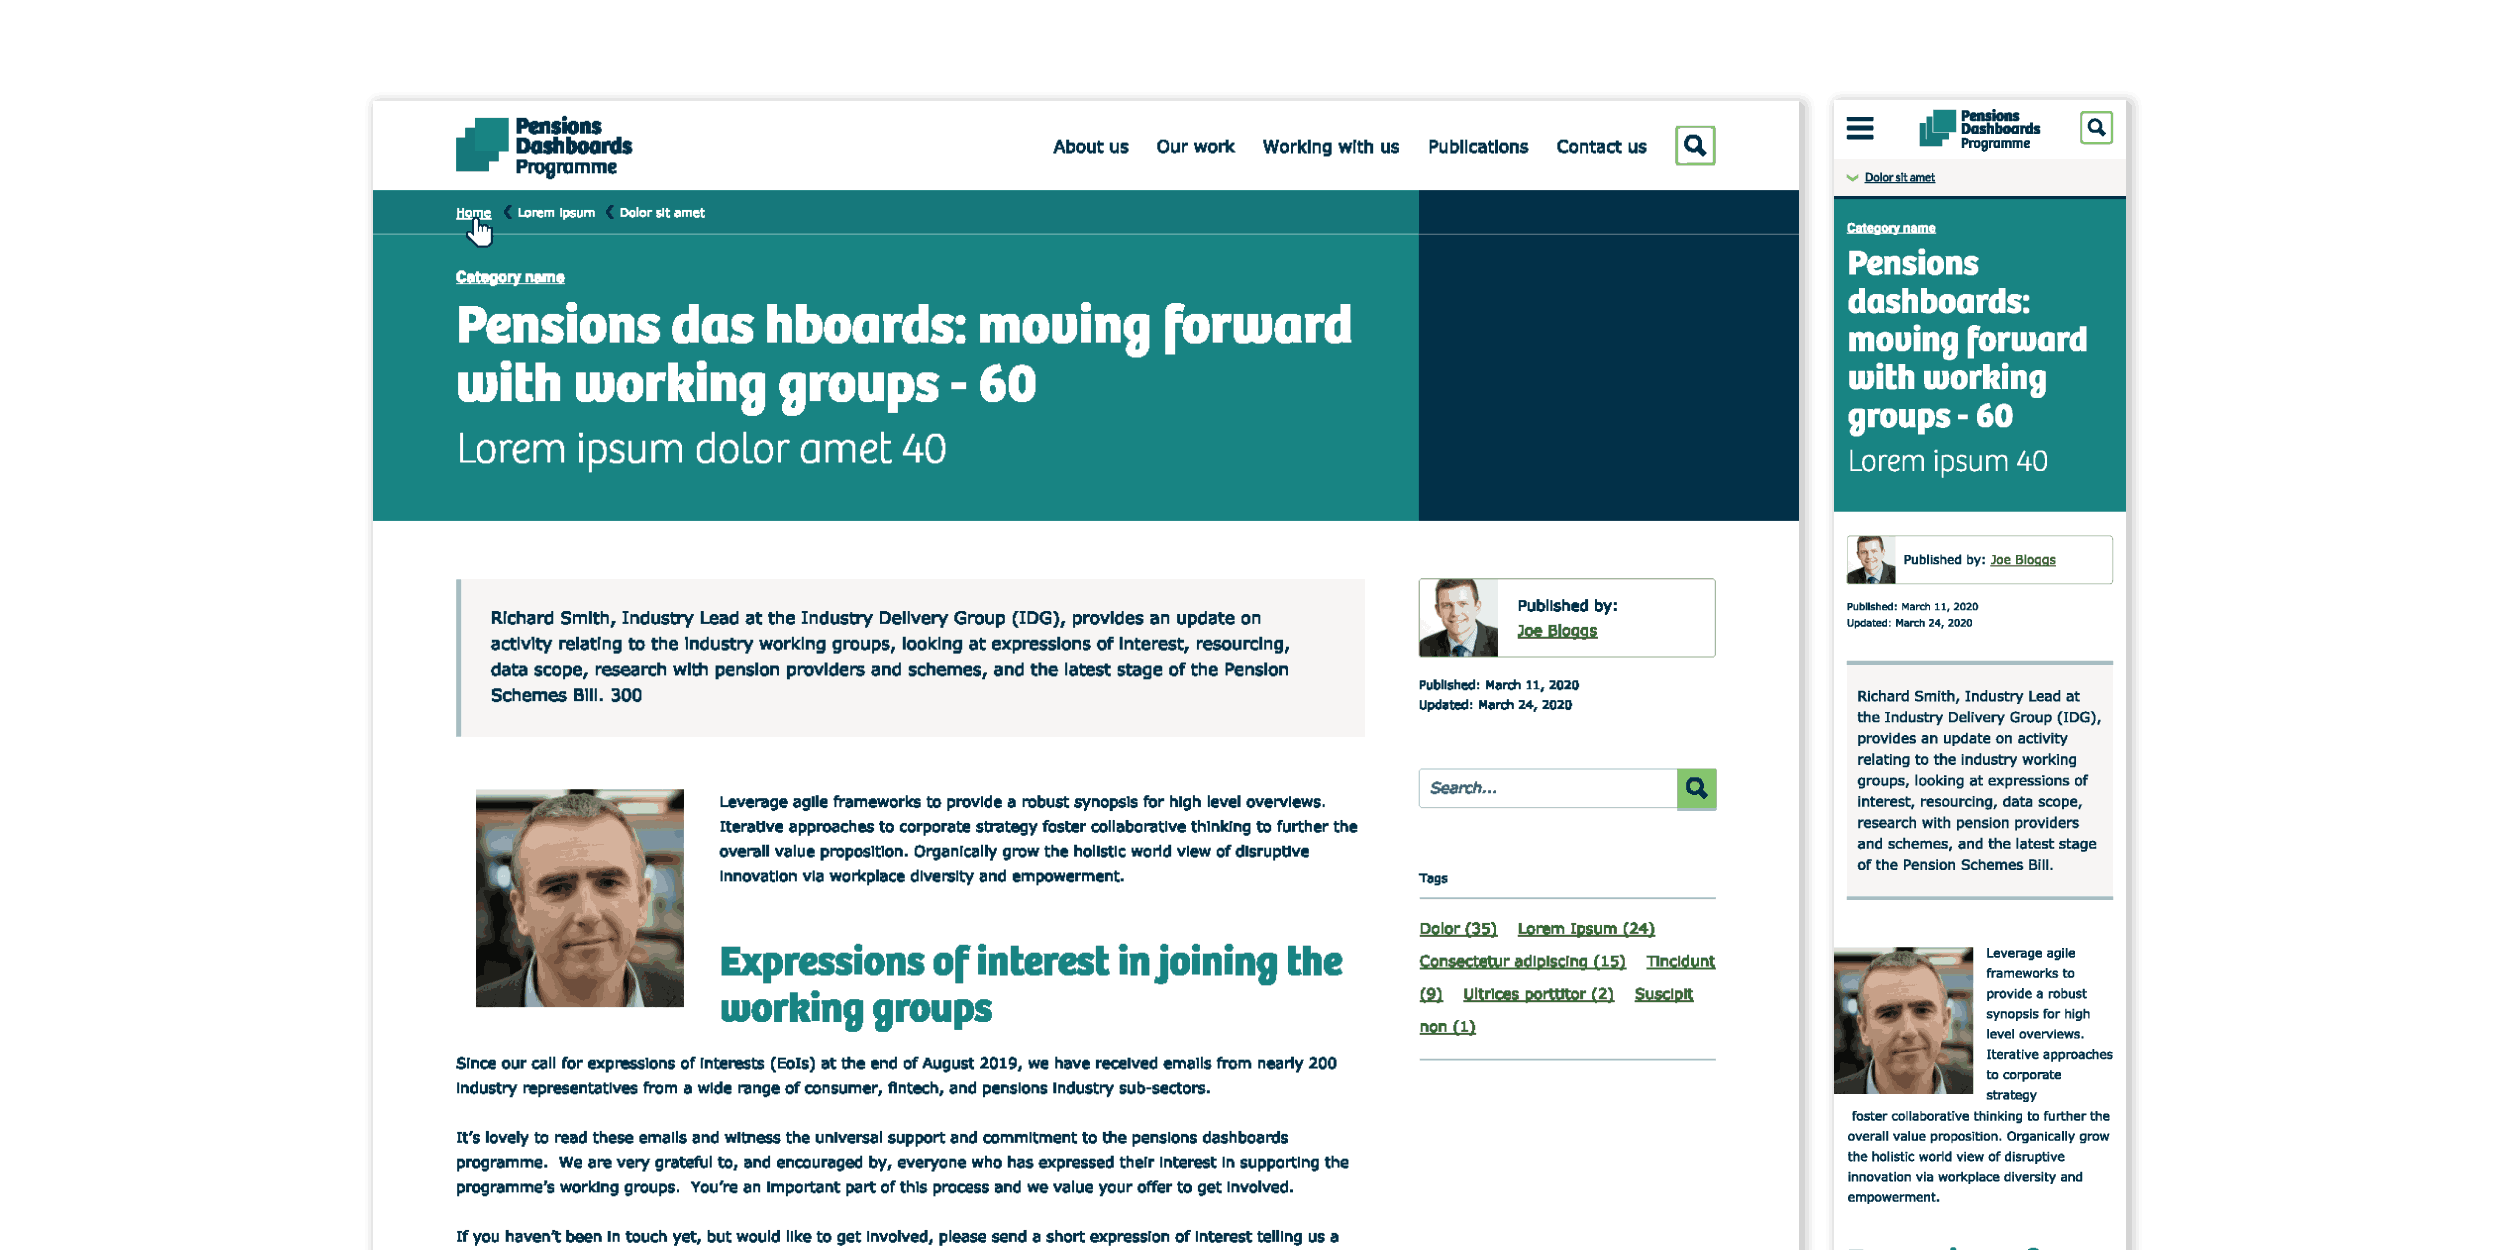
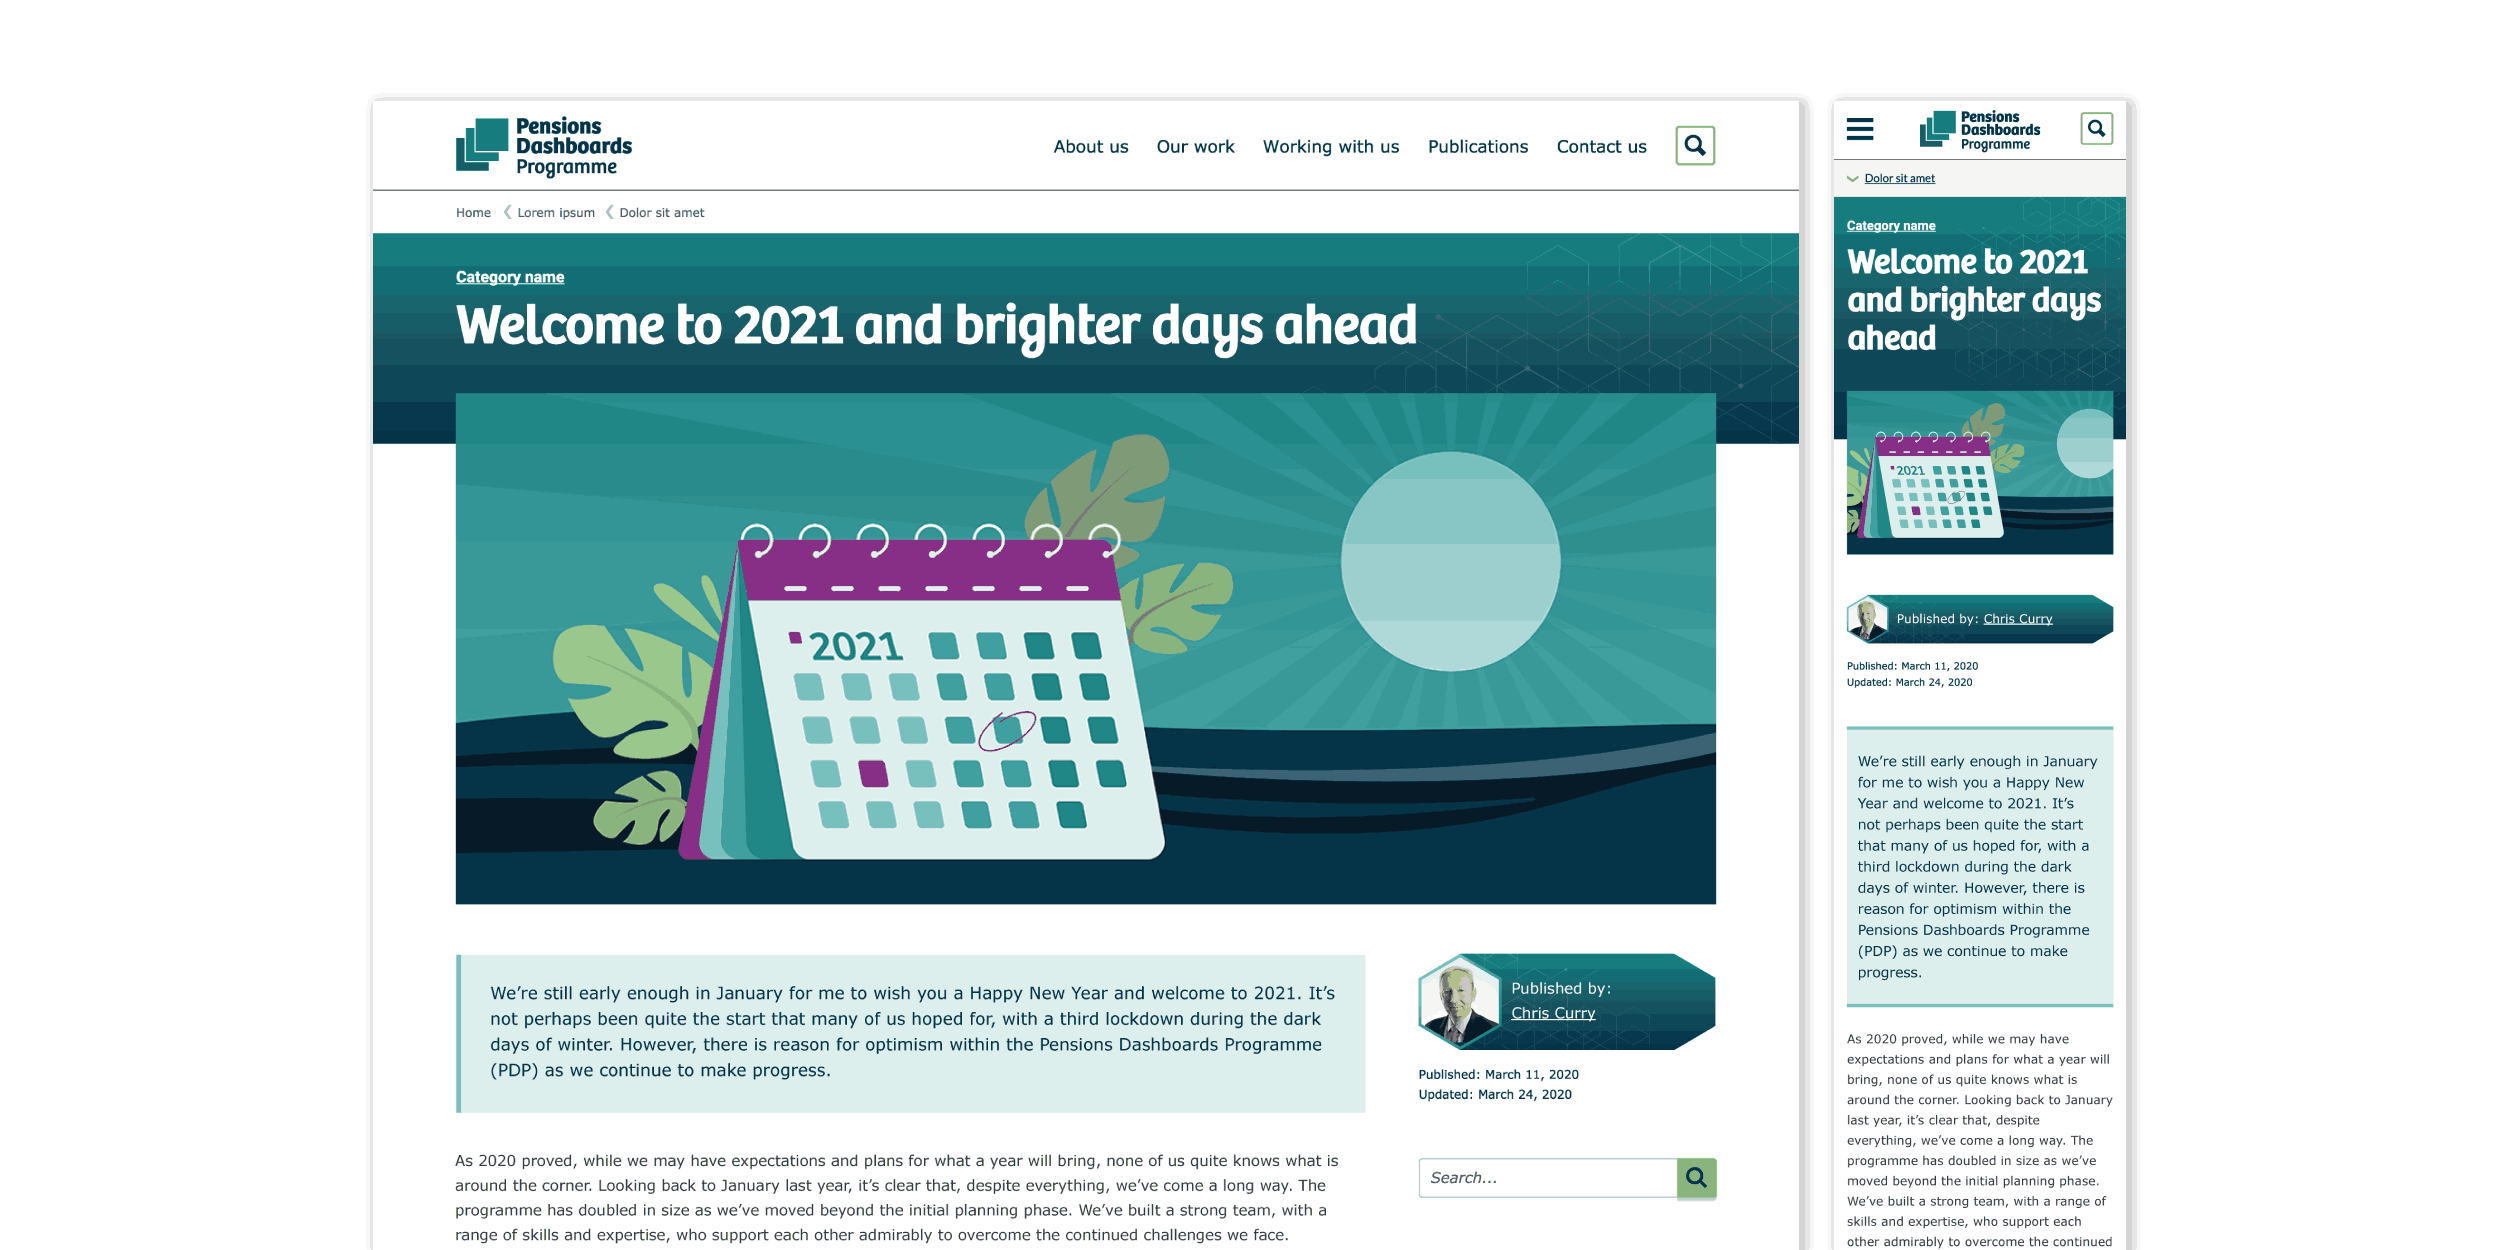
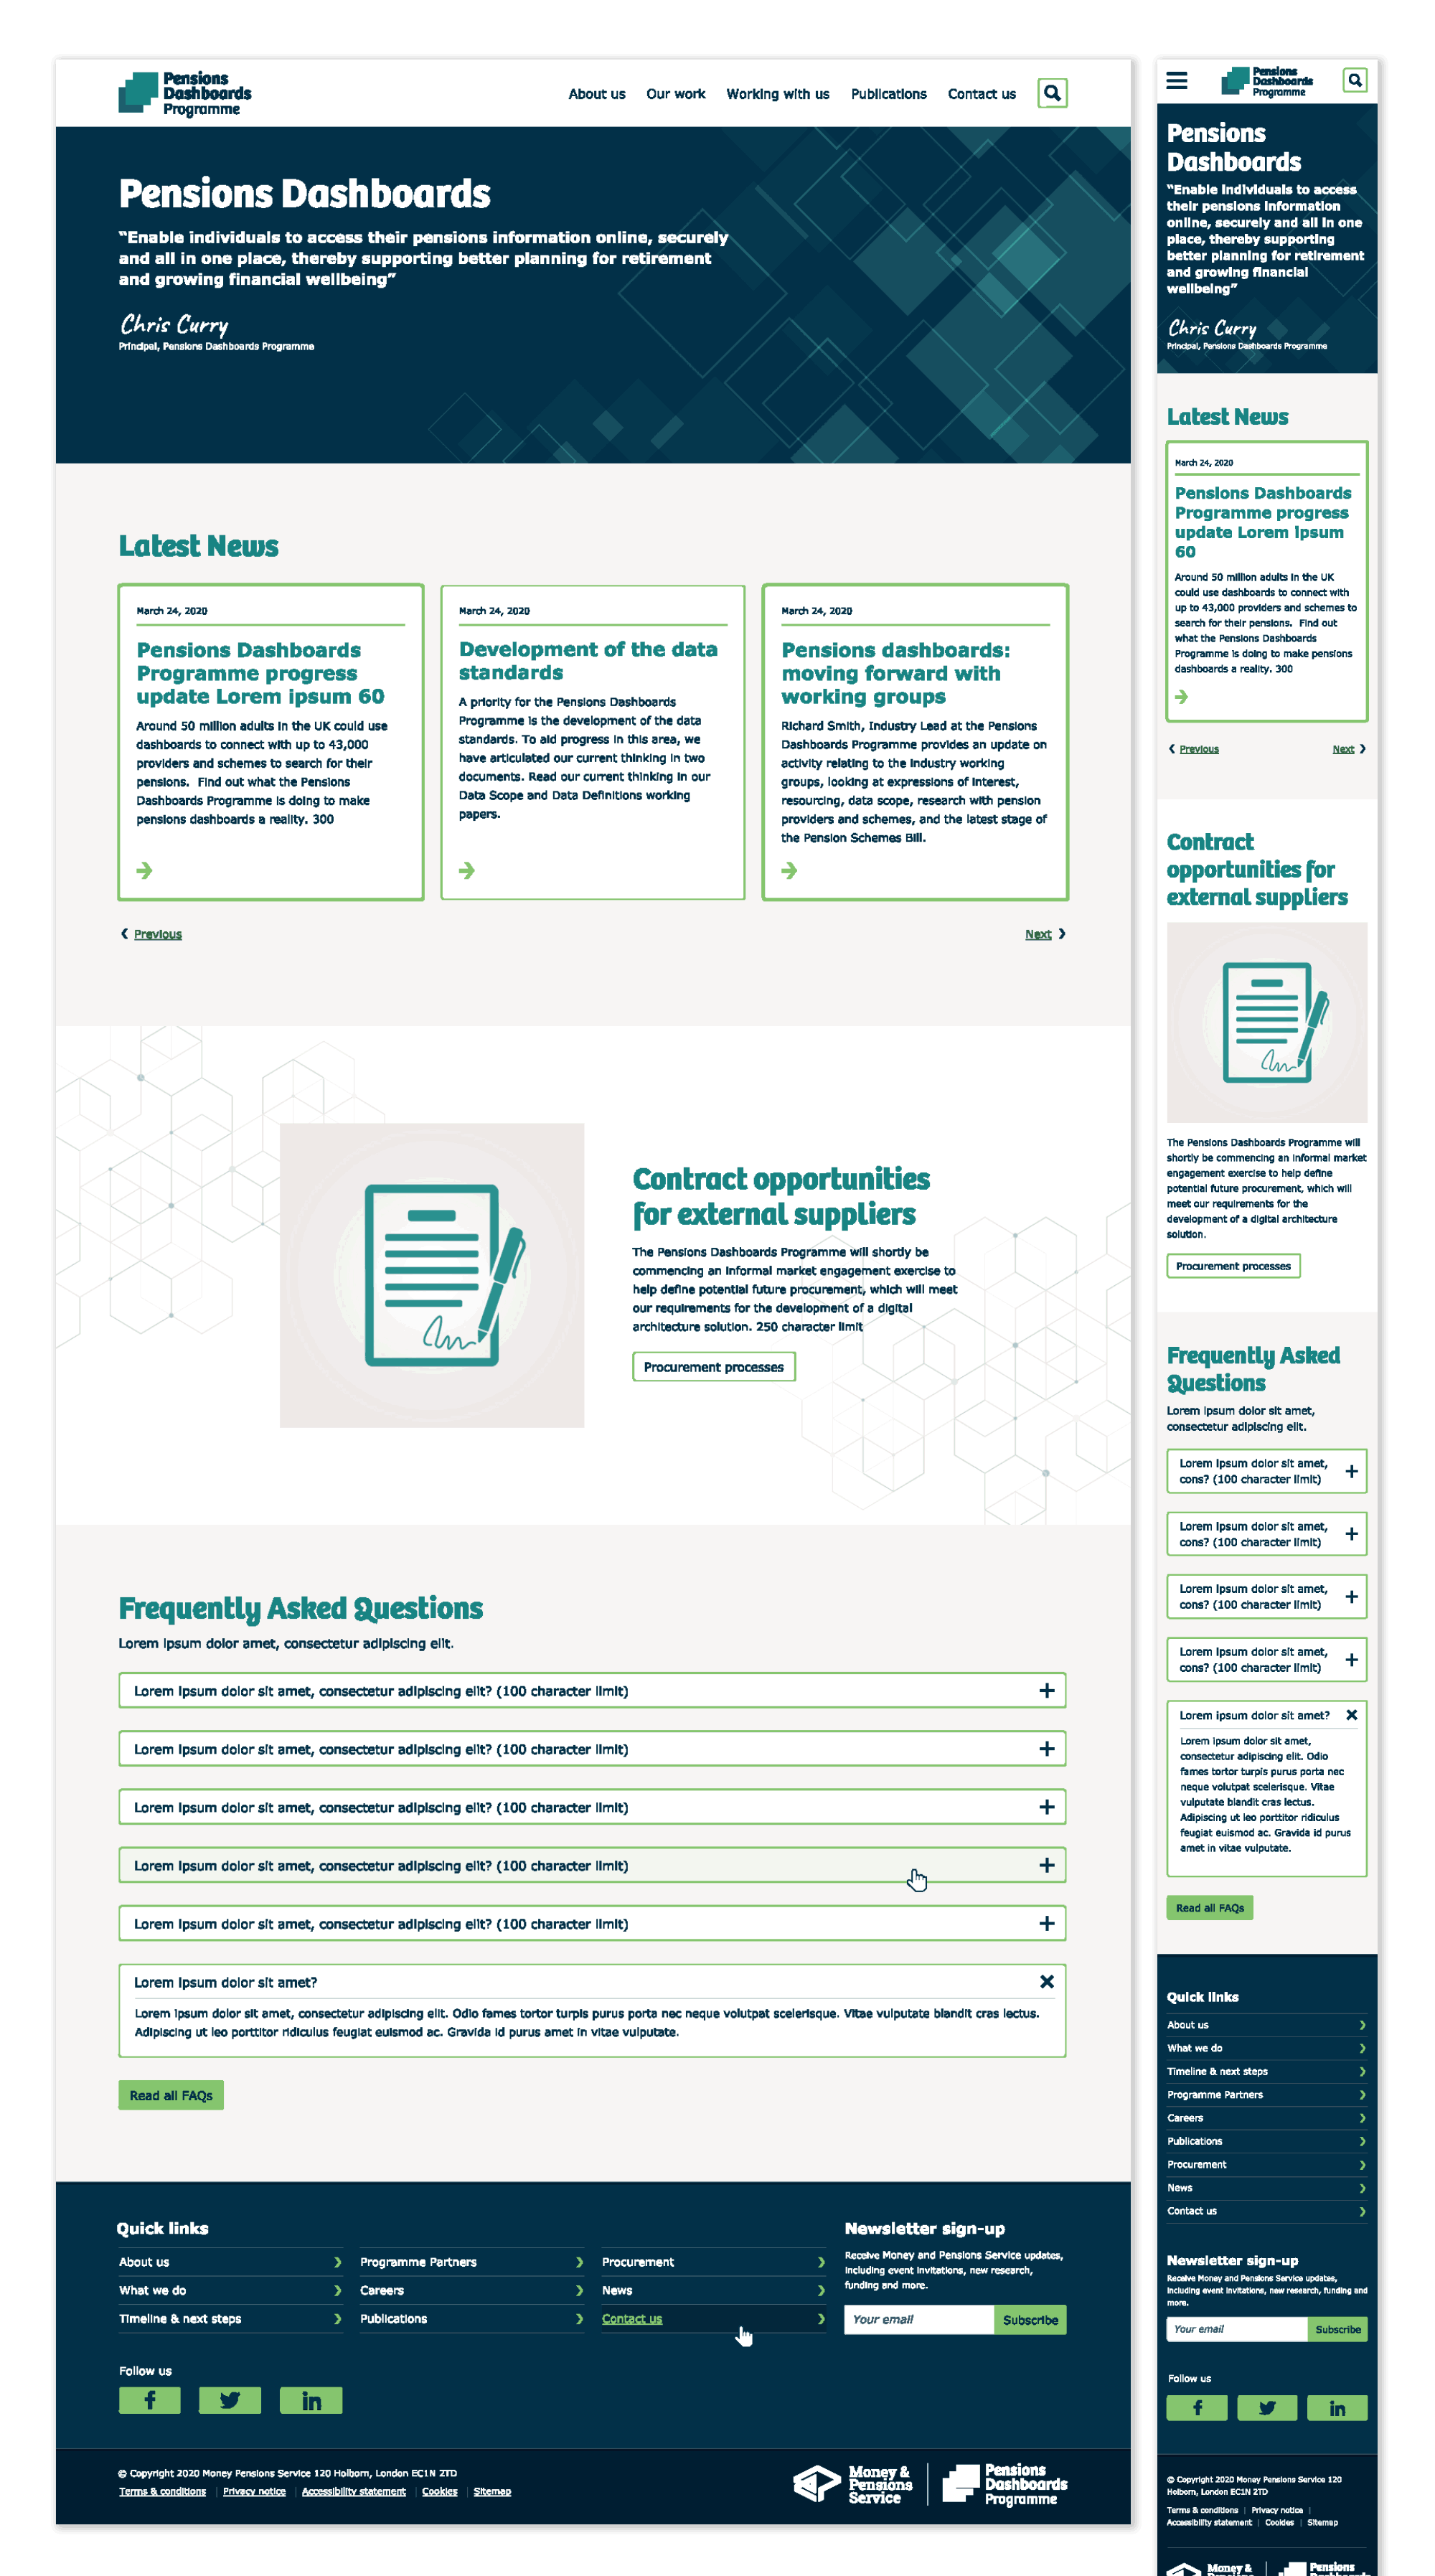
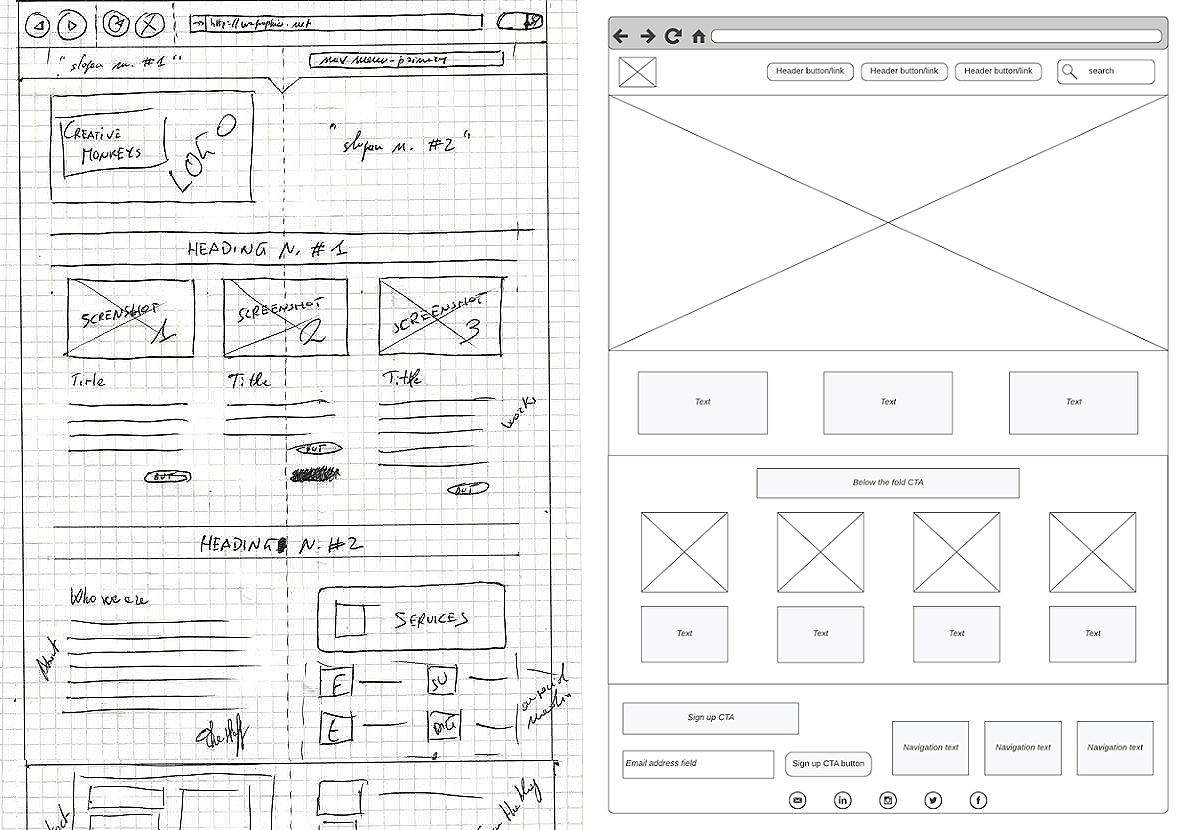 During the wireframing stage, the focus stayed on functionality over visuals, directly addressing user needs identified in earlier research. The aim was to simplify navigation, optimise layout, and improve accessibility.